America’s Flood Mapping Expansion Shows How Public Data Can Strengthen Community Resilience
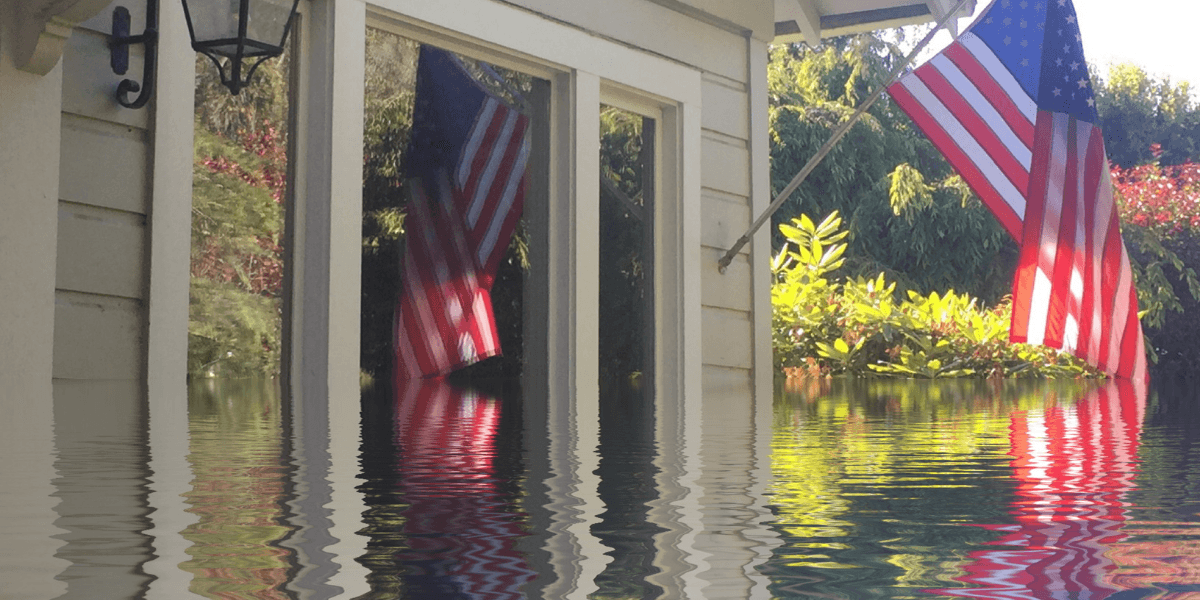
Expanded federal flood mapping shows how accessible public data can help communities understand hazards and prepare for emergencies.
When a river begins rising, technical measurements alone may not tell a family whether a nearby road could become impassable or help a community understand which areas face potential flooding. On September 24, 2026, a major expansion of federal flood mapping offered a practical response to that information gap. The National Oceanic and Atmospheric Administration announced that its experimental Flood Inundation Mapping system now provides coverage reaching nearly 100 percent of the U.S. population, up from approximately 60 percent previously.
The expansion illustrates a broader principle in public policy: information created with public resources can become more useful when ordinary people can understand and access it. Flood forecasts have long helped officials monitor rivers, but translating water levels into geographic impacts can provide communities with additional context. NOAA’s system is designed to show where flooding could occur, helping transform complex forecasting information into maps that residents, emergency managers, first responders, and local institutions can interpret.
Public Flood Data Can Make Risk Easier To Understand
Flood Inundation Mapping, commonly called FIM, now covers approximately 3.3 million river miles nationwide. The September expansion added areas including Florida and the southeastern coast, New England, the Great Lakes, the Rocky Mountains, the Dakotas, and western Nebraska.
The system combines hydrological information with geographic mapping to estimate the possible extent of river flooding. Rather than telling users only that a river could reach a particular level, the maps provide a visual representation of where water may spread under modeled conditions.
That difference matters because effective public information must be understandable as well as accurate.
A river gauge reading can be valuable to hydrologists and emergency officials who know how to interpret it. A resident deciding whether a nearby roadway or neighborhood may be affected can benefit from seeing the potential geographic extent of the water. Public facing mapping can help bridge the distance between scientific measurement and practical understanding.
Local Communities Need Information Before A Crisis Peaks
The expansion builds on several years of development. NOAA launched Flood Inundation Mapping services in 2023 with coverage reaching roughly 10 percent of the U.S. population. By 2025, that figure had increased to approximately 60 percent. The September 2026 expansion brings the service to nearly the entire population.
Previous emergencies have demonstrated how mapping can support local decision making.
During flooding in Tennessee in spring 2025, National Weather Service personnel used the system to provide information that contributed to an evacuation at a senior assisted living facility before floodwater reached the property. In Arkansas, mapping information was shared with officials as evacuations took place during flooding.
The system was also used during severe storms in central Texas in July 2025. National Weather Service personnel provided mapping information to emergency management officials in Georgetown, where authorities were making decisions about evacuations and road closures.
Those examples do not mean a map can prevent a disaster. They demonstrate something more practical. Better information can give local officials another tool for understanding how a developing event may affect the places where people actually live.
Accessible Infrastructure Includes Digital Infrastructure
Discussions about public infrastructure often focus on roads, bridges, water systems, power networks, and public buildings. Yet information systems are increasingly part of the infrastructure communities rely upon during emergencies.
Flood mapping is one example.
Weather satellites gather observations. Forecast models process enormous amounts of data. River gauges record changing conditions. Meteorologists interpret forecasts. The value of that network increases when information reaches people in a form they can understand.
This is particularly relevant when hazards cross jurisdictional boundaries. Rivers flow through multiple communities, and storms can affect urban centers, small towns, agricultural regions, and transportation corridors simultaneously. A widely available mapping system gives different users access to a common source of information while allowing them to examine conditions relevant to their own locations.
Broad access is therefore an important feature of the September expansion. A national information system becomes more useful when its benefits are not concentrated in a limited number of regions.
Federal Tools Still Have Important Limits
The expansion should not be interpreted as providing perfect knowledge about future flooding. NOAA continues to describe Flood Inundation Mapping as experimental.
Models depend on available observations and assumptions, while real world conditions can change rapidly. Local drainage problems, intense rainfall, damaged infrastructure, and other factors can affect flooding in ways that may not be captured perfectly by a national model.
Coverage also remains incomplete in northern and western Alaska, Guam, the Northern Mariana Islands, and American Samoa. Hawaii, Puerto Rico, and the U.S. Virgin Islands have mapping services available in several forms.
For those reasons, residents should treat flood maps as an additional source of information rather than a replacement for National Weather Service warnings or instructions from local emergency authorities.
Better Public Information Can Build Stronger Communities
The September 24 expansion offers a useful example of how public technology can connect national scientific capacity with local needs.
Federal agencies possess enormous amounts of environmental data. The policy challenge is ensuring that information becomes understandable and accessible enough to help people make informed decisions.
Flood Inundation Mapping moves in that direction by translating complex river forecasts into a geographic picture of potential impacts. Its continued development, careful evaluation, and broad public accessibility can help communities better understand the hazards around them.
For public policy, that is the larger takeaway. Resilience depends not only on responding after disasters occur. It also depends on giving communities credible information before conditions become critical.

Democrat Digest Contributor
This article features partner, contributor, or branded content from a third party. Members of the Democrat Digest editorial staff were not involved in the creation of this content. All views and opinions are those of the contributor alone.
You May Also Like
The Northeast Nor’easter Shows Why Weather Preparedness Must Become Part Of Everyday Life

NASA’s Fire Amoeba Discovery Is A Reminder That Science Still Has The Power To Surprise Us

Meta’s Facebook And Instagram Outage Disrupts Thousands Of Users Across The United States
Great Miami Hurricane Centennial Highlights A Century Of Progress In Storm Forecasting
Great Miami Hurricane Centennial Highlights A Century Of Progress In Storm Forecasting